|
原文链接:这里
0.前言
项目中最近要使用echarts做那种看起来高大上的图。于是搞起了echarts。本文主要介绍angualr中如何使用echarts。
anuglar CLI 11.5
1.新建angular项目
新建项目参考:angular从0到1:环境安装及运行 – 每天进步一点点 (longkui.site)
2.引入echarts
我们安装echarts,使用下面两个指令。
npm install echarts --save (yarn add echarts)
npm install ngx-echarts --save (yarn add ngx-echarts)
然后我们在package.json(有两个,最外层那个)中可以看到我们刚才安装的echarts。
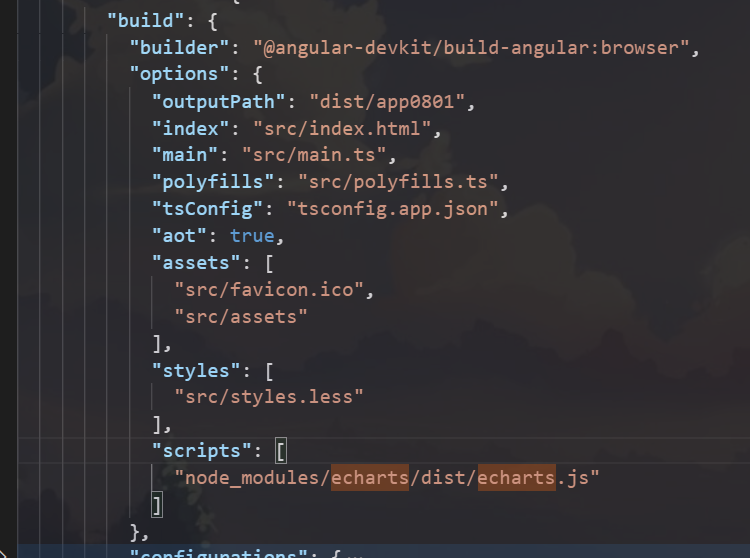
然后找到angular.json。找到build/options中。
然后在scripts中添加下面的这段代码:
"node_modules/echarts/dist/echarts.js"
然后我们在app.module.ts中使用引入echarts(实际开发中,自己新建一个module,同样的操作引入)。
导入:
import { NgxEchartsModule } from 'ngx-echarts';
然后我们打开app.component.html文件。
<div style="height: 500px;" id ="testchart" >测试图表</div>
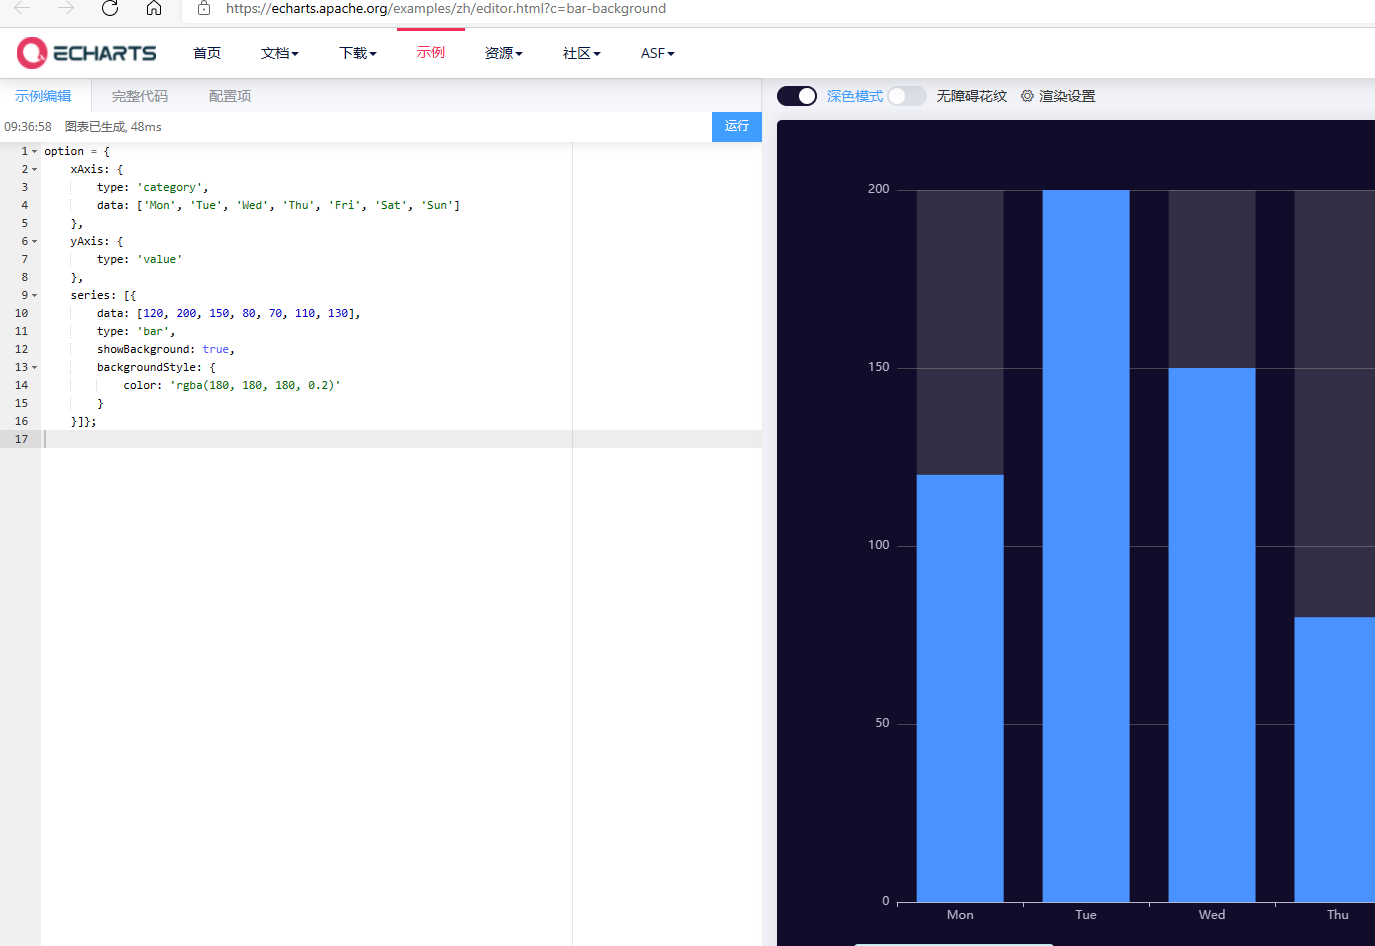
然后我们打开Echarts 的实例。
Examples – Apache ECharts
data: ['Mon', 'Tue', 'Wed', 'Thu', 'Fri', 'Sat', 'Sun']
data: [120, 200, 150, 80, 70, 110, 130],
color: 'rgba(180, 180, 180, 0.2)'
我们在app.component.ts 添加如下代码
import { Component, OnInit } from '@angular/core';
import * as echarts from 'echarts';
templateUrl: './app.component.html',
styleUrls: ['./app.component.less']
export class AppComponent implements OnInit {
var chartDom = document.getElementById('testchart');
var myChart = echarts.init(chartDom);
data: ['Mon', 'Tue', 'Wed', 'Thu', 'Fri', 'Sat', 'Sun']
data: [120, 200, 150, 80, 70, 110, 130],
color: 'rgba(180, 180, 180, 0.2)'
option && myChart.setOption(option);
如果报错:ERROR in The target entry-point “ngx-echarts” has missing dependencies:@juggle/resize-observer。请点击这里解决。
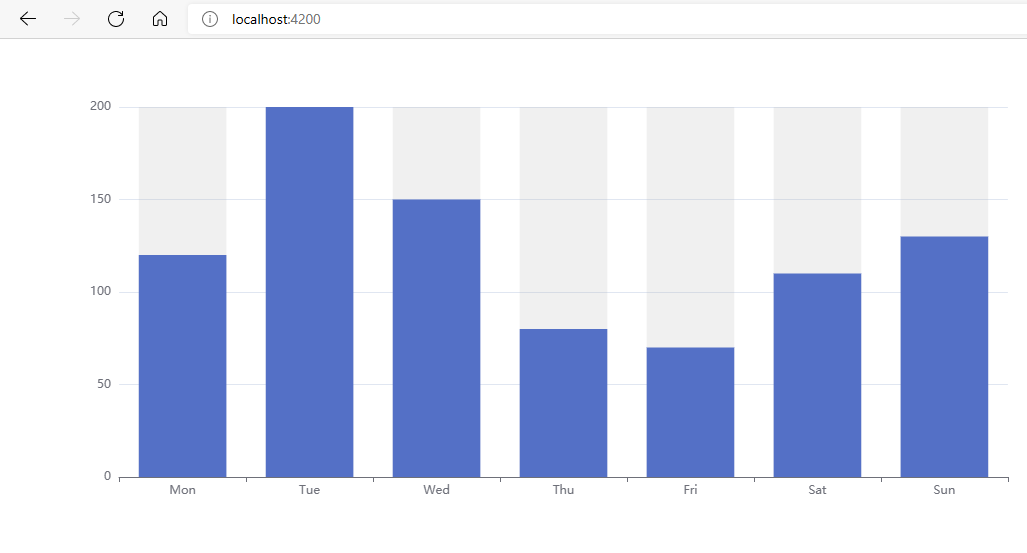
然后执行 ng serve
来源:https://www.cnblogs.com/longkui-site/p/15859509.html |



 發表於 2022-2-1 19:40:00