|
在 Kubernetes 的生态中,在多个维度、多个层次提供了不同的组件来满足不同的伸缩场景。
有三种弹性伸缩:
-
CA(Cluster Autoscaler):Node级别自动扩/缩容 cluster-autoscaler组件
-
HPA(Horizontal Pod Autoscaler):Pod个数自动扩/缩容
-
VPA(Vertical Pod Autoscaler):Pod配置自动扩/缩容,主要是CPU、内存 addon-resizer组件
如果在云上建议 HPA 结合 cluster-autoscaler 的方式进行集群的弹性伸缩管理。
node自动扩容缩容
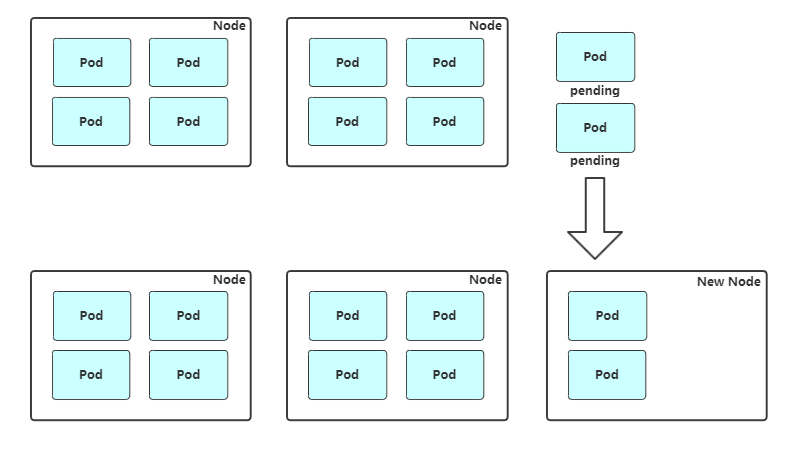
扩容:Cluster AutoScaler 定期检测是否有充足的资源来调度新创建的 Pod,当资源不足时会调用 Cloud Provider 创建新的 Node。
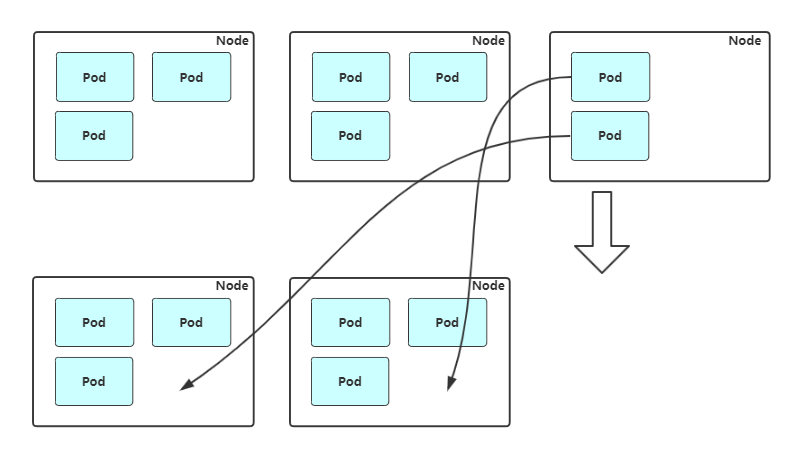
缩容:Cluster AutoScaler 也会定期监测 Node 的资源使用情况,当一个 Node 长时间资源利用率都很低时(低于 50%)自动将其所在虚拟机从云服务商中删除。此时,原来的 Pod 会自动调度到其他 Node 上面。
支持的云提供商:
-
阿里云:https://github.com/kubernetes/autoscaler/blob/master/cluster-autoscaler/cloudprovider/alicloud/README.md
-
AWS: https://github.com/kubernetes/autoscaler/blob/master/cluster-autoscaler/cloudprovider/aws/README.md
-
Azure: https://github.com/kubernetes/autoscaler/blob/master/cluster-autoscaler/cloudprovider/azure/README.md
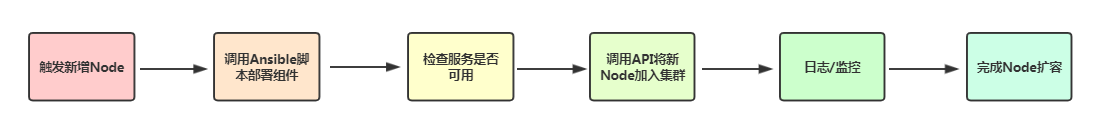
ansiable扩容node流程
1. 触发新增Node
2. 调用Ansible脚本部署组件
3. 检查服务是否可用
4. 调用API将新Node加入集群或者启用Node自动加入
5. 观察新Node状态
6. 完成Node扩容,接收新Pod
node缩容流程:
#获取节点列表
kubectl get node

#设置不可调度
kubectl cordon $node_name

#驱逐节点上的pod
kubectl drain $node_name --ignore-daemonsets

#移除节点
kubectl delete node $node_name
POD自动扩容缩容 (HPA)
Horizontal Pod Autoscaler(HPA,Pod水平自动伸缩),根据资源利用率或者自定义指标自动调整replication controller, deployment 或 replica set,实现部署的自动扩展和缩减,让部署的规模接近于实际服务的负载。HPA不适于无法缩放的对象,例如DaemonSet。
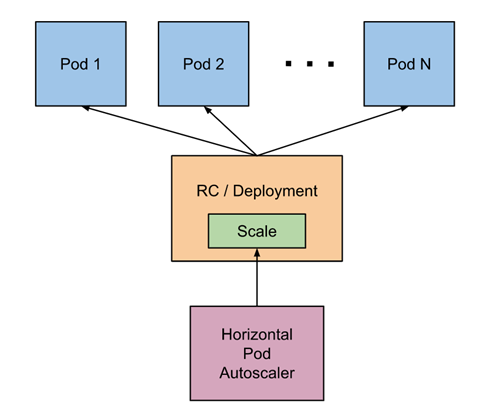
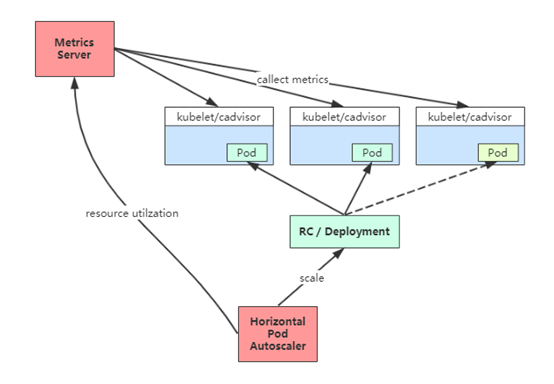
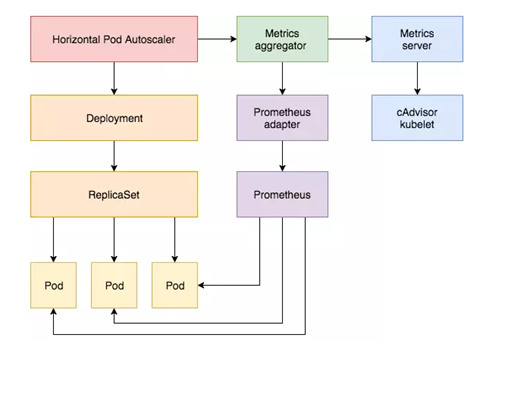
HPA基本原理
Kubernetes 中的 Metrics Server 持续采集所有 Pod 副本的指标数据。HPA 控制器通过 Metrics Server 的 API(Heapster 的 API 或聚合 API)获取这些数据,基于用户定义的扩缩容规则进行计算,得到目标 Pod 副本数量。当目标 Pod 副本数量与当前副本数量不同时,HPA 控制器就向 Pod 的副本控制器(Deployment、RC 或 ReplicaSet)发起 scale 操作,调整 Pod 的副本数量,完成扩缩容操作。如图所示。
在弹性伸缩中,冷却周期是不能逃避的一个话题, 由于评估的度量标准是动态特性,副本的数量可能会不断波动。有时被称为颠簸, 所以在每次做出扩容缩容后,冷却时间是多少。
在 HPA 中,默认的扩容冷却周期是 3 分钟,缩容冷却周期是 5 分钟。
可以通过调整kube-controller-manager组件启动参数设置冷却时间:
HPA的演进历程:
目前 HPA 已经支持了 autoscaling/v1、autoscaling/v2beta1和autoscaling/v2beta2 三个大版本 。
目前大多数人比较熟悉是autoscaling/v1,这个版本只支持CPU一个指标的弹性伸缩。
而autoscaling/v2beta1增加了支持自定义指标,autoscaling/v2beta2又额外增加了外部指标支持。
而产生这些变化不得不提的是Kubernetes社区对监控与监控指标的认识与转变。从早期Heapster到Metrics Server再到将指标边界进行划分,一直在丰富监控生态。
示例:
#v1版本:
apiVersion: autoscaling/v1
kind: HorizontalPodAutoscaler
metadata:
  name: php-apache
  namespace: default
spec:
  scaleTargetRef:
    apiVersion: apps/v1
    kind: Deployment
    name: php-apache
  minReplicas: 1
  maxReplicas: 10
  targetCPUUtilizationPercentage: 50


#v2beta2版本:
apiVersion: autoscaling/v2beta2
kind: HorizontalPodAutoscaler
metadata:
  name: php-apache
  namespace: default
spec:
  scaleTargetRef:
    apiVersion: apps/v1
    kind: Deployment
    name: php-apache
  minReplicas: 1
  maxReplicas: 10
  metrics:
  - type: Resource
    resource:
      name: cpu
      target:
        type: Utilization
        averageUtilization: 50
  - type: Pods
    pods:
      metric:
        name: packets-per-second
      target:
        type: AverageValue
        averageValue: 1k
  - type: Object
    object:
      metric:
        name: requests-per-second
      describedObject:
        apiVersion: networking.k8s.io/v1beta1
        kind: Ingress
        name: main-route
      target:
        type: Value
        value: 10k
  - type: External
    external:
      metric:
        name: queue_messages_ready
        selector: "queue=worker_tasks"
      target:
        type: AverageValue
        averageValue: 30
基于CPU指标缩放
Kubernetes API Aggregation
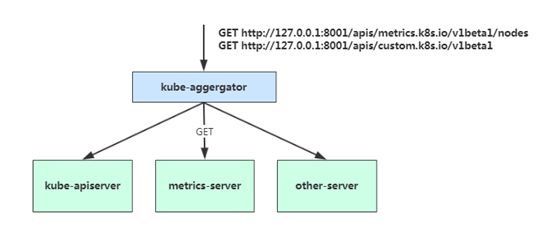
在 Kubernetes 1.7 版本引入了聚合层,允许第三方应用程序通过将自己注册到kube-apiserver上,仍然通过 API Server 的 HTTP URL 对新的 API 进行访问和操作。为了实现这个机制,Kubernetes 在 kube-apiserver 服务中引入了一个 API 聚合层(API Aggregation Layer),用于将扩展 API 的访问请求转发到用户服务的功能。
当你访问 apis/metrics.k8s.io/v1beta1 的时候,实际上访问到的是一个叫作 kube-aggregator 的代理。而 kube-apiserver,正是这个代理的一个后端;而 Metrics Server,则是另一个后端 。通过这种方式,我们就可以很方便地扩展 Kubernetes 的 API 了。
如果你使用kubeadm部署的,默认已开启。如果你使用二进制方式部署的话,需要在kube-APIServer中添加启动参数,增加以下配置:
# vi /opt/kubernetes/cfg/kube-apiserver.conf
...
--requestheader-client-ca-file=/opt/kubernetes/ssl/ca.pem \
--proxy-client-cert-file=/opt/kubernetes/ssl/server.pem \
--proxy-client-key-file=/opt/kubernetes/ssl/server-key.pem \
--requestheader-allowed-names=kubernetes \
--requestheader-extra-headers-prefix=X-Remote-Extra- \
--requestheader-group-headers=X-Remote-Group \
--requestheader-username-headers=X-Remote-User \
--enable-aggregator-routing=true \
...
在设置完成重启 kube-apiserver 服务,就启用 API 聚合功能了。
部署 Metrics Server
Metrics Server是一个集群范围的资源使用情况的数据聚合器。作为一个应用部署在集群中。
Metric server从每个节点上Kubelet公开的摘要API收集指标。
Metrics server通过Kubernetes聚合器注册在Master APIServer中。
部署清单地址:https://github.com/kubernetes-sigs/metrics-server
# git clone https://github.com/kubernetes-incubator/metrics-server

修改deployment.yaml文件,修正集群问题
问题1:metrics-server默认使用节点hostname通过kubelet 10250端口获取数据,但是coredns里面没有该数据无法解析(10.96.0.10:53),可以在metrics server启动命令添加参数 --kubelet-preferred-address-types=InternalIP 直接使用节点IP地址获取数据

问题2:kubelet 的10250端口使用的是https协议,连接需要验证tls证书。可以在metrics server启动命令添加参数--kubelet-insecure-tls不验证客户端证书

问题3:yaml文件中的image地址k8s.gcr.io/metrics-server-amd64:v0.3.0 需要梯子,需要改成中国可以访问的image地址,可以使用aliyun的。这里使用hub.docker.com里的google镜像地址 image: mirrorgooglecontainers/metrics-server-amd64:v0.3.1

kubectl apply -f .
kubectl get pod -n kube-system
可通过Metrics API在Kubernetes中获得资源使用率指标,例如容器CPU和内存使用率。这些度量标准既可以由用户直接访问(例如,通过使用kubectl top命令),也可以由集群中的控制器(例如,Horizontal Pod Autoscaler)用于进行决策。
测试:
kubectl get --raw /apis/metrics.k8s.io/v1beta1/nodes
kubectl top node
kubectl get apiservice |grep metrics
kubectl describe apiservice v1beta1.metrics.k8s.io
autoscaling/v1(CPU指标实践)
autoscaling/v1版本只支持CPU一个指标。
创建HPA策略:
# kubectl get pod
NAME                         READY   STATUS    RESTARTS   AGE
java-demo-8548998c57-d4wkp   1/1     Running   0          12m
java-demo-8548998c57-w24x6   1/1     Running   0          11m
java-demo-8548998c57-wbnrs   1/1     Running   0          11m
# kubectl autoscale deployment java-demo --cpu-percent=50 --min=3 --max=10 --dry-run -o yaml > hpa-v1.yaml
# cat hpa-v1.yaml
apiVersion: autoscaling/v1
kind: HorizontalPodAutoscaler
metadata:
  name: java-demo
spec:
  maxReplicas: 10
  minReplicas: 3
  scaleTargetRef:
    apiVersion: apps/v1
    kind: Deployment
    name: java-demo
  targetCPUUtilizationPercentage: 50
# kubectl apply -f hpa-v1.yaml
# kubectl get hpa
NAME        REFERENCE              TARGETS   MINPODS   MAXPODS   REPLICAS   AGE
java-demo   Deployment/java-demo   1%/50%    3         10        3          10m
# kubectl describe hpa java-demo
scaleTargetRef:表示当前要伸缩对象是谁
targetCPUUtilizationPercentage:当整体的资源利用率超过50%的时候,会进行扩容。
开启压测:
# yum install httpd-tools -y
# kubectl get svc
NAME         TYPE        CLUSTER-IP   EXTERNAL-IP   PORT(S)   AGE
java-demo    ClusterIP   10.0.0.215   <none>        80/TCP    171m
# ab -n 100000 -c 100 http://10.0.0.215/index
This is ApacheBench, Version 2.3 <$Revision: 1430300 $>
Copyright 1996 Adam Twiss, Zeus Technology Ltd, http://www.zeustech.net/
Licensed to The Apache Software Foundation, http://www.apache.org/

Benchmarking 10.0.0.215 (be patient)
Completed 10000 requests
Completed 20000 requests
Completed 30000 requests
Completed 40000 requests
Completed 50000 requests
Completed 60000 requests
Completed 70000 requests
Completed 80000 requests
apr_socket_recv: Connection refused (111)
Total of 85458 requests completed
检测扩容状态
# kubectl get hpa
NAME        REFERENCE              TARGETS     MINPODS   MAXPODS   REPLICAS   AGE
java-demo   Deployment/java-demo   1038%/50%   3         10        10         165m

# kubectl get pod
NAME                         READY   STATUS    RESTARTS   AGE
java-demo-77d4f5cdcf-4chv4   1/1     Running   0          56s
java-demo-77d4f5cdcf-9bkz7   1/1     Running   0          56s
java-demo-77d4f5cdcf-bk9mk   1/1     Running   0          156m
java-demo-77d4f5cdcf-bv68j   1/1     Running   0          41s
java-demo-77d4f5cdcf-khhlv   1/1     Running   0          41s
java-demo-77d4f5cdcf-nvdjh   1/1     Running   0          56s
java-demo-77d4f5cdcf-pqxvb   1/1     Running   0          41s
java-demo-77d4f5cdcf-pxgl9   1/1     Running   0          41s
java-demo-77d4f5cdcf-qqk6q   1/1     Running   0          156m
java-demo-77d4f5cdcf-tkct6   1/1     Running   0          156m

# kubectl top pod
NAME                         CPU(cores)   MEMORY(bytes)
java-demo-77d4f5cdcf-4chv4   2m           269Mi
java-demo-77d4f5cdcf-bk9mk   2m           246Mi
java-demo-77d4f5cdcf-cwzwz   2m           177Mi
java-demo-77d4f5cdcf-cz7hj   3m           220Mi
java-demo-77d4f5cdcf-fb9zl   3m           197Mi
java-demo-77d4f5cdcf-ftjht   3m           194Mi
java-demo-77d4f5cdcf-qdxqf   2m           174Mi
java-demo-77d4f5cdcf-qx52w   2m           175Mi
java-demo-77d4f5cdcf-rfrlh   3m           220Mi
java-demo-77d4f5cdcf-xjzjt   2m           176Mi
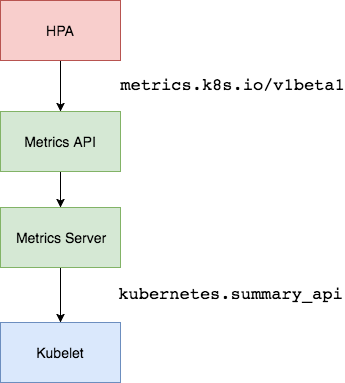
工作流程:hpa -> apiserver -> kube aggregation -> metrics-server -> kubelet(cadvisor)
autoscaling/v2beta2(多指标)
为满足更多的需求, HPA 还有 autoscaling/v2beta1和 autoscaling/v2beta2两个版本。
这两个版本的区别是 autoscaling/v1beta1支持了 Resource Metrics(CPU)和 Custom Metrics(应用程序指标),而在 autoscaling/v2beta2的版本中额外增加了External Metrics的支持。
apiVersion: autoscaling/v2beta2
kind: HorizontalPodAutoscaler
metadata:
  name: java-demo
  namespace: default
spec:
  scaleTargetRef:
    apiVersion: apps/v1
    kind: Deployment
    name: web
  minReplicas: 1
  maxReplicas: 10
  metrics:
  - resource:
    type: Resource
      name: cpu
      target:
        averageUtilization: 60
        type: Utilization
与上面v1版本效果一样,只不过这里格式有所变化。
v2还支持其他另种类型的度量指标,:Pods和Object。
type: Pods
pods:
  metric:
    name: packets-per-second
  target:
    type: AverageValue
    averageValue: 1k
type: Object
object:
  metric:
    name: requests-per-second
  describedObject:
    apiVersion: networking.k8s.io/v1beta1
    kind: Ingress
    name: main-route
  target:
    type: Value
    value: 2k
metrics中的type字段有四种类型的值:Object、Pods、Resource、External。
-
Resource:指的是当前伸缩对象下的pod的cpu和memory指标,只支持Utilization和AverageValue类型的目标值。
-
Object:指的是指定k8s内部对象的指标,数据需要第三方adapter提供,只支持Value和AverageValue类型的目标值。
-
Pods:指的是伸缩对象Pods的指标,数据需要第三方的adapter提供,只允许AverageValue类型的目标值。
-
External:指的是k8s外部的指标,数据同样需要第三方的adapter提供,只支持Value和AverageValue类型的目标值。
apiVersion: autoscaling/v2beta2
kind: HorizontalPodAutoscaler
metadata:
  name: java-demo
  namespace: default
spec:
  scaleTargetRef:
    apiVersion: apps/v1
    kind: Deployment
    name: java-demo
  minReplicas: 1
  maxReplicas: 10
  metrics:
  - type: Resource
    resource:
      name: cpu
      target:
        type: Utilization
        averageUtilization: 50
  - type: Pods
    pods:
      metric:
        name: packets-per-second
      target:
        type: AverageValue
        averageValue: 1k
  - type: Object
    object:
      metric:
        name: requests-per-second
      describedObject:
        apiVersion: networking.k8s.io/v1beta1
        kind: Ingress
        name: main-route
      target:
        type: Value
        value: 10k
基于Prometheus自定义指标缩放
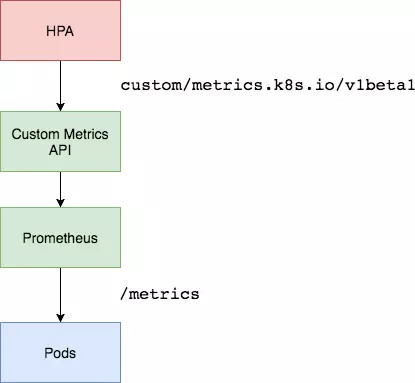
资源指标只包含CPU、内存,一般来说也够了。但如果想根据自定义指标:如请求qps/5xx错误数来实现HPA,就需要使用自定义指标了,目前比较成熟的实现是 Prometheus Custom Metrics。自定义指标由Prometheus来提供,再利用k8s-prometheus-adpater聚合到apiserver,实现和核心指标(metric-server)同样的效果。
工作流程:hpa -> apiserver -> kube aggregation -> prometheus-adapter -> prometheus -> pods
部署 Custom Metrics Adapter
但是prometheus采集到的metrics并不能直接给k8s用,因为两者数据格式不兼容,还需要另外一个组件(k8s-prometheus-adpater),将prometheus的metrics 数据格式转换成k8s API接口能识别的格式,转换以后,因为是自定义API,所以还需要用Kubernetes aggregator在主APIServer中注册,以便直接通过/apis/来访问。
https://github.com/DirectXMan12/k8s-prometheus-adapter
该 PrometheusAdapter 有一个稳定的Helm Charts,我们直接使用。
先准备下helm环境:
wget https://get.helm.sh/helm-v3.0.0-linux-amd64.tar.gz
tar zxvf helm-v3.0.0-linux-amd64.tar.gz
mv linux-amd64/helm /usr/bin/
helm repo add stable http://mirror.azure.cn/kubernetes/charts
helm repo update
helm repo list
部署prometheus-adapter,指定prometheus地址:
# helm install prometheus-adapter stable/prometheus-adapter --namespace kube-system --set prometheus.url=http://prometheus.kube-system,prometheus.port=9090
# helm list -n kube-system
NAME                    NAMESPACE       REVISION        UPDATED                                 STATUS        CHART                    APP VERSION
prometheus-adapter      kube-system     1               2020-05-28 11:38:35.156622425 +0800 CST deployed      prometheus-adapter-2.3.1 v0.6.0
确保适配器注册到APIServer:
# kubectl get apiservices |grep custom
# kubectl get --raw "/apis/custom.metrics.k8s.io/v1beta1"
基于QPS指标实践
部署应用暴露prometheus指标接口,可以通过访问service看到
apiVersion: apps/v1
kind: Deployment
metadata:
  labels:
    app: metrics-app
  name: metrics-app
spec:
  replicas: 3
  selector:
    matchLabels:
      app: metrics-app
  template:
    metadata:
      labels:
        app: metrics-app
      annotations:
        prometheus.io/scrape: "true"
        prometheus.io/port: "80"
        prometheus.io/path: "/metrics"
    spec:
      containers:
      - image: lizhenliang/metrics-app
        name: metrics-app
        ports:
        - name: web
          containerPort: 80
        resources:
          requests:
            cpu: 200m
            memory: 256Mi
        readinessProbe:
          httpGet:
            path: /
            port: 80
          initialDelaySeconds: 3
          periodSeconds: 5
        livenessProbe:
          httpGet:
            path: /
            port: 80
          initialDelaySeconds: 3
          periodSeconds: 5
---
apiVersion: v1
kind: Service
metadata:
  name: metrics-app
  labels:
    app: metrics-app
spec:
  ports:
  - name: web
    port: 80
    targetPort: 80
  selector:
    app: metrics-app


# curl 10.99.15.240/metrics
# HELP http_requests_total The amount of requests in total
# TYPE http_requests_total counter
http_requests_total 86
# HELP http_requests_per_second The amount of requests per second the latest ten seconds
# TYPE http_requests_per_second gauge
http_requests_per_second 0.5
创建HPA策略
使用Prometheus提供的指标测试来测试自定义指标(QPS)的自动缩放。
# vi app-hpa-v2.yml
apiVersion: autoscaling/v2beta2
kind: HorizontalPodAutoscaler
metadata:
  name: metrics-app-hpa
  namespace: default
spec:
  scaleTargetRef:
    apiVersion: apps/v1
    kind: Deployment
    name: metrics-app
  minReplicas: 1
  maxReplicas: 10
  metrics:
  - type: Pods
    pods:
      metric:
        name: http_requests_per_second
      target:
        type: AverageValue
        averageValue: 800m   # 800m 即0.8个/秒
配置适配器收集特定的指标
当创建好HPA还没结束,因为适配器还不知道你要什么指标(http_requests_per_second),HPA也就获取不到Pod提供指标。
ConfigMap在default名称空间中编辑prometheus-adapter ,并seriesQuery在该rules: 部分的顶部添加一个新的:
# kubectl edit cm prometheus-adapter -n kube-system
apiVersion: v1
kind: ConfigMap
metadata:
  labels:
    app: prometheus-adapter
    chart: prometheus-adapter-v0.1.2
    heritage: Tiller
    release: prometheus-adapter
  name: prometheus-adapter
data:
  config.yaml: |
    rules:
    - seriesQuery: 'http_requests_total{kubernetes_namespace!="",kubernetes_pod_name!=""}'
      resources:
        overrides:
          kubernetes_namespace: {resource: "namespace"}
          kubernetes_pod_name: {resource: "pod"}
      name:
        matches: "^(.*)_total"
        as: "${1}_per_second"
      metricsQuery: 'sum(rate(<<.Series>>{<<.LabelMatchers>>}[2m])) by (<<.GroupBy>>)'
...
该规则将http_requests在2分钟的间隔内收集该服务的所有Pod的平均速率。
测试API:
kubectl get --raw "/apis/custom.metrics.k8s.io/v1beta1/namespaces/default/pods/*/http_requests_per_second"
压测
ab -n 100000 -c 100 http://10.99.15.240/metrics
查看PHA状态
kubectl get hpa
kubectl describe hpa metrics-app-hpa
小结
-
通过/metrics收集每个Pod的http_request_total指标;
-
prometheus将收集到的信息汇总;
-
APIServer定时从Prometheus查询,获取request_per_second的数据;
-
HPA定期向APIServer查询以判断是否符合配置的autoscaler规则;
-
如果符合autoscaler规则,则修改Deployment的ReplicaSet副本数量进行伸缩。
来源:https://www.cnblogs.com/yuezhimi/p/12970558.html |


 發表於 2020-5-28 14:41:00